Common Introduction to all 6 Posts
History and Context
These blog posts are an extension of my efforts to convince evaluators to shift their focus from complex systems to specific behaviors of complex systems. We need to make this switch because there is no practical way to apply the notion of a “complex system” to decisions about program models, metrics, or methodology. But we can make practical decisions about models, metrics, and methodology if we attend to the things that complex systems do. My current favorite list of complex system behavior that evaluators should attend to is:
| Complexity behavior | Posting date |
| · Emergence | up |
| · Power law distributions | up |
| · Network effects and fractals | up |
| · Unpredictable outcome chains | Oct. 5 |
| · Consequence of small changes | Oct. 12 |
| · Joint optimization of uncorrelated outcomes | Oct. 19 |
For a history of my activity on this subject see: PowerPoint presentations: 1, 2, and 3; fifteen minute AEA “Coffee Break” videos 4, 5, and 6; long comprehensive video: 7.
Since I began thinking of complexity and evaluation in this way I have been uncomfortable with the idea of just having a list of seemingly unconnected items. I have also been unhappy because presentations and lectures are not good vehicles for developing lines of reasoning. I wrote these posts to address these dissatisfactions.
From my reading in complexity I have identified four themes that seem relevant for evaluation.
- Pattern
- Predictability
- How change happens
- Adaptive and evolutionary behavior
Others may pick out different themes, but these are the ones that work for me. Boundaries among these themes are not clean, and connections among them abound. But treating them separately works well enough for me, at least for right now.
Figure 1 is a visual depiction of my approach to this subject.
 Figure 1: Complex Behaviors and Complexity Themes Figure 1: Complex Behaviors and Complexity Themes |
- The black rectangles on the left depict a scenario that pairs a well-defined program with a well-defined evaluation, resulting in a clear understanding of program outcomes. I respect evaluation like this. It yields good information, and there are compelling reasons working this way. (For reasons why I believe this, see 1 and 2.)
- The blue region is there to indicate that no matter how clear cut the program and the evaluation; it is also true that both the program and the evaluation are embedded in a web of entities (programs, policies, culture, regulation, legislation, etc.) that interact with our program in unknown and often unknowable ways.
- The green region depicts what happens over time. The program may be intact, but the contextual web has evolved in unknown and often unknowable ways. Such are the ways of complex systems.
- Recognizing that we have a complex system, however, is not amenable to developing program theory, formulating methodology, or analyzing and interpreting data. For that, we need to focus on the behaviors of complex systems, as depicted in the red text in the table. Note that the complex behaviors form the rows of a table. The columns show the complexity themes. The Xs in the cells show which themes relate to which complexity behaviors.
Network Structure and Fractals
| Pattern
|
Predictability
|
How change happens | Adaptive evolutionary behavior | |
| Emergence | ||||
| Power law distributions | ||||
| Network effects and fractals | X | |||
| Unspecifiable outcome chains | ||||
| Consequence of small changes | ||||
| Joint optimization of uncorrelated outcomes |
Any time a program is concerned with the spread of its services or impact over time, the subject of networks becomes a candidate for attention by evaluators. This is because: 1) It can be of value to know the pattern that describes how a program moves from one adopting location to another. 2) Network structure is a useful concept when the spread of a program constitutes an outcome to be evaluated. 3) Network structure is a useful construct when evaluating the degree to which a set of connections is efficient, effective, and resilient in the face of breakage.
Pattern of Diffusion among Adopting Sites
A great deal of useful evaluation information can be obtained by tracking the network trajectory of a program’s spread over time. I constructed Figure 2 to illustrate this point. The top of Figure 2 depicts the adoption of an innovative program. At first (blue), 1:1 relationships among adopting organizations seem to be important to spur adoption. Then, (green) those relationships disappear. Adoption happens without those 1:1 relationships.
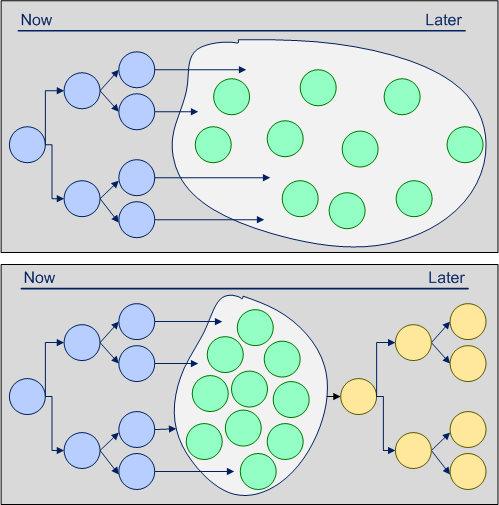
| Figure 2: Two and Three Stage Diffusion Scenarios |
Knowing this pattern could give planners plenty of opportunity to consider possibilities that might affect what they do in the future. For instance, the pattern may lead planners to speculate that because of the program’s innovative nature, 1:1 relationships between programs are needed to provide new adopters with both confidence and technical assistance. Then, as familiarity with the innovation spreads, people developed enough confidence to motivate adoption on their own. Of course this is only one of many possible explanations. Another may be that over time a cottage industry of consultants has grown up to assist with adoption.
The bottom scenario in Figure 2 is more enigmatic. The first two phases make sense, as described above. But why the third phase (yellow), in which 1:1 relationships matter again? Perhaps reversion to the 1:1 pattern signifies the beginnings of adoption among populations not originally intended to implement the program? Because there is no data, this explanation is pure speculation. But it is the kind of speculation that might lead to productive policy and planning. These kinds of considerations would never arise if the only pattern available came from observing the inflection points on a traditional adoption curve. Ideally the evaluation would have collected data to explain the network pattern, but even if it did not, knowing the pattern would provide planners with plenty of insight. Good thing the evaluators had the foresight and wisdom to collect that data!
Diffusion of the Program Model as an Outcome to be Evaluated
The section above was silent as to whether spread of the program model was one of the intended outcomes. If it were, then evaluators would do well to include network behavior in their methodology. My intent here is to convey an intuitive sense of why knowing about the network might be a useful component of studying innovation diffusion as an outcome. First I’ll discuss network development. Then I’ll discuss how network structure can be useful for assessing how robust the network is with respect to breakage. (Technical discussions of networks abound. Two that I am particularly fond of are #1, and #2.)
Network evolution as a measure of program outcome

Figure 3: Two Scenarios — Diffusion as an Outcome |
Imagine two scenarios in which one of the intended outcomes of a program was its spread to other settings. The program theory holds that spread needs to be facilitated by technical assistance interactions among adopting sites. Figure 3 illustrates two scenarios which depict the flow of information among the adopting sites.
Note that the number of communications is exactly the same in both scenarios. That number alone, however, hides information that might be useful to program planners. At the top of Figure 3, the original implementing site does all the technical assistance work. In the second scenario (bottom of Figure 3), the technical assistance work is passed from one adopting organization to another. Sharing makes adoption spread more quickly. For good measure I use cross-hatching to show that some of the adopting sites on the bottom are not exactly faithful to the original program design.
The data reveal a tradeoff between getting the work done faster, and fidelity to the original program design. This is the kind of knowledge that can only come when network development is tracked over time. The outcome in both scenarios is the same in the sense that same number of organizations adopt the innovation. Qualitatively however, the pattern is different, and may have different implications for planning similar programs in the future.
Efficiency, Effectiveness, and Resilience
It’s not hard to imagine evaluation situations where it matters whether a network minimizes its use of resources, or is redundant but expensive to build and maintain. In these situations it helps to have an understanding of fractals.
“Fractals are complex patterns that are self-similar, and therefore exhibit similar patterns at every scale.” What this mean is that without an external reference, it is impossible to know how “close” or how “far” one is from the fractal that is being observed. Fractals are mathematical constructs that do not exist in the physical world. But many real world phenomena approximate fractals, including the shape of snowflakes, tree branching, blood vessel layout, the shape of coastlines, internet connections, and road and highway arrangements, to name but a few.
Fractal structure is an important concept for understanding how a network responds when links are broken. This is another topic that has an extensive literature and much mathematical formality. Here all I want to do is to convey an intuitive sense of why understanding fractals might answer some important evaluation questions. (Robustness of complex networks in Wikipedia is a good technical treatment of this topic, complete with many references to the relevant literature.)
Think of infrastructure networks, as for example: 1) roads connecting towns, 2) water pipelines, 3) referral, information and resource sharing among primary, secondary and tertiary health care facilities, or 4) government departments working on a common problem. All of these examples involve networked relationships that can vary with respect to efficiency of resource use (e.g. physical material or people’s time), and resilience, i.e. system degradation if a link breaks. One extreme design is complete redundancy. Everything is connected to everything else. This makes for a highly robust, but very resource intensive system. The other extreme is an efficient system that will lose a lot of capacity if a link breaks. Think of light bulbs connected in series. If a connection is broken, everything on one side of the break loses power. Fractal arrangements are the best compromise between these two extremes. (This explanation is a narrow sliver of the very technical and wider ranging subject of “highly optimized tolerance” in designed and natural systems. I chose the network example because it is particularly relevant for the kind of work we do. If you really want to get into the details, go here.)
What does this mean for evaluation? It means that if an evaluation involves any kind of networked entities, and if robustness and efficiency are matters of interest, then the evaluation needs to assess the network structure. The more fractal-like the structure, the better the compromise between easily broken networks, and highly redundant, expensive networks.
I am not arguing that networks should fall at any point on the efficient to redundant continuum. That is a determination for program planners to make. I am only arguing that there may be evaluations in which the place on the continuum is an important outcome. Were that to be the case, the fractal nature of the network provides a logical midpoint that may be useful when the network data are interpreted.
