Common Introduction to all sections
This is part 8 of 10 blog posts I’m writing to convey the information that I present in various workshops and lectures that I deliver about complexity. I’m an evaluator so I think in terms of evaluation, but I’m convinced that what I’m saying is equally applicable for planning.
I wrote each post to stand on its own, but I designed the collection to provide a wide-ranging view of how research and theory in the domain of “complexity” can contribute to the ability of evaluators to show stakeholders what their programs are producing, and why. I’m going to try to produce a YouTube video on each section. When (if?) I do, I’ll edit the post to include the YT URL.
| Part | Title | Approximate post date |
| 1 | Complex systems or complex behavior? | up |
| 2 | Complexity has awkward implications for program designers and evaluators | up |
| 3 | Ignoring complexity can make sense | up |
| 4 | Complex behavior can be evaluated using comfortable, familiar methodologies | up |
| 5 | A pitch for sparse models | up |
| 6 | Joint optimization of unrelated outcomes | up |
| 7 | Why should evaluators care about emergence? | up |
| 8 | Why might it be useful to think of programs and their outcomes in terms of attractors? | up |
| 9 | A few very successful programs, or many, connected, somewhat successful programs? | 8/9 |
| 10 | Evaluating for complexity when programs are not designed that way | 8/19 |
Why might it be useful to think of programs and their outcomes in terms of attractors?
Exercises to understand the historical behavior of a program, (or a class of programs), is a worthwhile activity in any evaluation. People should always do it. My hope in this blog post, however, is to make a convincing case that the concept of an “attractor” provides a richer way to think about a program’s history, its likely behavior in the future, and its outcomes.
The Wikipedia definition of an attractor is:
In the mathematical field of dynamical systems, an attractor is a set of numerical values toward which a system tends to evolve, for a wide variety of starting conditions of the system. System values that get close enough to the attractor values remain close even if slightly disturbed.
With a definition like that, it helps to know what Wikipedia thinks a dynamical system is.
In mathematics, a dynamical system is a system in which a function describes the time dependence of a point in a geometrical space. Examples include the mathematical models that describe the swinging of a clock pendulum, the flow of water in a pipe, and the number of fish each springtime in a lake.
Figure 1 shows some more examples of attractors. #1 is a map of watersheds in the United States. #2 shows multiple animal species at a watering hole. #3, well let’s just say that this one is my favorite. #4 shows planetary orbits.
The pictures in Figure 1 have a limitation, namely that the constructs they depict are real objects in physical space. It’s not just that certain elevations describe water flow. It’s that physical water follows through those elevations. It’s not just that playgrounds appeal to kids. It’s that real kids inhabit the playground space. This coincidence of attractor and physical object does not apply to all attractors. A particularly shaped physical space can also be used to describe less tangible constructs. To telegraph an example I’ll use later, an attractor space in the shape of a pendulum can be used to describe fluctuations in government policy.

Why bother to think in terms of attractors?
Why might it be worth thinking of programs and their outcomes in terms of attractors? Why not just rely on observing history and be done with it? Because thinking in terms of attractors:
- Provides insightful visualization of how outcomes may change over time.
- Kicks program theory up in the level of abstraction, thus revealing similarities and differences among seemingly different activities.
- Can reveal likely system behavior even without good historical data.
To illustrate, I’ll use the example of a federal regulatory agency. Between a lot of evaluation I have done, a lot of reading relevant literature, and quite a bit of talking to close observers, this is a subject I know something about.
There is some very interesting social science research and theory on the question of maintaining safety by emphasizing rule compliance or engaging in cooperative activity between government and industry. It’s a complicated story, but the bottom line is that neither strategy can be entirely successful by itself, and that getting the mix right at any given time is a tricky problem. In fact, the most effective mix moves back and forth with circumstances. A dated, but good explanation of this phenomenon is Shapiro, S. A., & Rabinowitz, R. S. (1997). Punishment versus cooperation in regulatory enforcement: A case study of Osha. Administrative Law Review, 49(4). For a more general discussion, try: Sparrow, Malcom K. The Regulatory Craft: Controlling Risks, Solving Problems, and Managing Compliance 2000.
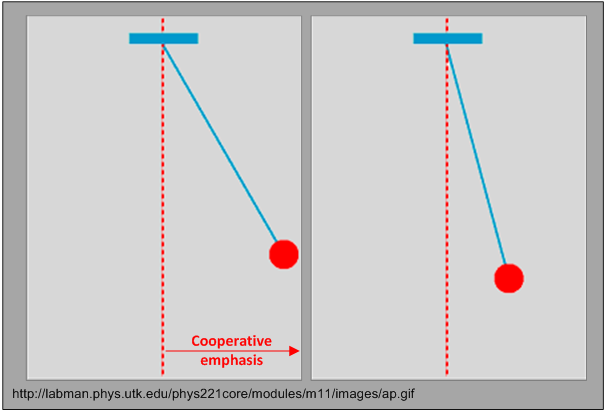
The image of a pendulum comes to mind. Looking back, it seems as if the emphasis that regulatory agencies place on enforcing compliance and working cooperatively oscillates, moving in one direction and then swinging back in the other. One way to look at this is to say that the attractor space traces the ark of a pendulum. Figure 2 shows what have in mind. Figure 2 can be thought of as a form of program model that deliberately omits a great deal of information in order to highlight the oscillatory behavior of the program. (For much more on models, see Part 5 – A pitch for sparse models.)
Considering the argument I made above for thinking in terms of attractors and not exclusively in terms of program history, what’s the advantage here?
Visualization of how outcomes may change over time: Sometimes pictures help understanding, and I think this is one of those cases, particularly with respect to sustainability. Imagine evaluating a program designed to minimize a safety problem that was based on a cooperative program theory. No matter how successful that program, I’d assess the likelihood of long-term sustainability as lower in the scenario at the left rather than the scenario on the right? Why? Because I know the shape of the attractor. Of course the model leaves a lot out. It does not account for relationships between labor and management in the industry, or the inclinations of agency leadership, or developments in safety technology, or any of the myriad factors that may affect sustainability. All I know is the shape of the attractor and the location of the agency on it. Figure 2 is a sparse model that abstracts the attractor shape from all the other reasons that may affect sustainability. But it’s a sparse model that provides a lot of insight that would be obscured if I tried to build a mode that included labor/management relationships, the inclinations of policy makers, or developments in safety technology.
Level of abstraction: Figure 2 may be useful for understanding sustainability for one particular program in one particular regulatory agency, but it is also useful for revealing that the same attractor can be applied to any setting where the mission inclines toward enforcing compliance, but where the social reality of ensuring safety also calls for cooperation.
Historical data: It is always important to have empirical data on how an agency has behaved in the past. It’s one thing to draw a picture such as Figure 2, it is something else to have empirical knowledge of how much cooperation and enforcement is taking place, how long the trend has been going in one or another direction, what the balance point is, and so on. Unfortunately, in most instances an evaluator will not have such data. As examples of the difficulties involved, consider a few of the issues that spring to mind. 1) How obvious is it that a program falls into the categories of enforcement and cooperative emphasis? 2) How much activity is informal, and thus cannot be labeled as a “program” or a “policy” that can be identified and assessed? 3) What’s the metric for cooperation and enforcement? In the absence of good data, an evaluator may have to rely on expert judgement. That might provide a valid assessment, but it’s not very satisfying, either. It’s precisely because precise historical data may be lacking that attractor shapes provide insight. It may not take too much experience and historical knowledge to identify the general shape of an attractor and a reasonable sense of where an agency stands on it.
Before I move on to the next topic, I feel a need to make a point about the compliance/cooperation issue. The example I gave above springs from my own experience in evaluating cooperative programs. Please do not take this as an endorsement of a cooperation-only approach to improving safety. I do not believe that such a policy can be effective.
In the spirit of all models being wrong
I believe that the simple pendulum attractor model is useful because by ignoring many relevant issues, it succeeds at revealing some important program behaviors. But appreciating how the model is wrong is also revealing.
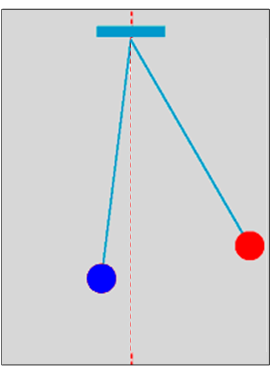
There are really two bobs: Figure 2 ignores the fact that there are always elements of cooperation and enforcement at play. Figure 3 is a more accurate portrayal of the situation.
Smooth versus discontinuous movement: The smooth, predictable movement of a pendulum bob does not characterize how regulatory agencies behave. Cooperation with industry can change very quickly in light of a plane crash, a railroad derailment that leaks toxic chemicals, a pipeline explosion, or an interstate bus that ran off the road. Programs and policies can be easily canceled in the light of legislative and public outcry. Implementing programs and policies, however, take time. Movement in a cooperative direction is incremental.
These are the kinds of dynamics that makes me such a strong advocate of employing multiple models when evaluating the same program. Figure 2 has the advantage of clearly portraying the attractor that governs the sustainability of cooperative programs. It provides that simplicity, however, by ignoring the model depicted in Figure 3, which recognizes the co-existence of enforcement and cooperation. If my sole interest was in sustainability, I’d stick with Figure 2. But if I was also interested in whether agency staff would accept the cooperative program, I might also look at Figure 3 because I’d posit that the balance of cooperative and enforcement efforts may be relevant to acceptance. “Also” is the operative word in the previous sentence. Both models would be useful, each for a different part of the evaluation.
I can also imagine doing evaluation in a regulatory agency that needed only the model in Figure 3. For example, imagine a program designed to enhance communication and cooperation among factions within the agency that had different opinions about the value of enforcement and cooperation. If I ever got lucky enough to do an evaluation like that, I’d start by invoking the model in Figure 3. It’s not that one model is correct and the other is incorrect. It’s a matter of each model being useful for different reasons.

One thought on “How can the concept of “attractors” be useful in evaluation? Part 8 of a 10-part series on how complexity can produce better insight on what programs do, and why”