Introduction to the Series
The primary objective of this series is to provide evaluators with the capability to apply constructs from Complexity Science to evaluation practice. This objective is bookended with two others. The first is to give evaluators a broad conceptual understanding of Complexity. The other is to provide an appreciation of how Complexity can influence how we conceptualize pattern, predictability, and the reasons for change. Our intention is to accomplish the primary goal within each case that is presented. The “bookended” goals will be achieved over time, as readers see the relevance of complexity in multiple cases.
This series will present cases based on examples drawn from ongoing or recently concluded evaluations. Each installment will present the case and then discuss how that work might be expanded or reinterpreted if constructs from Complexity Science were applied. For the sake of exposition each case will include only a few of the many interconnected aspects of complexity that may be applicable. Our hope is that over time and across cases, the full range of complexity’s contribution to evaluation will be revealed.
What is Complexity Science? As we proceed, it is worth contemplating the answer to an unanswerable question: What is Complexity Science? The best I can do is to paraphrase a Social Psychology professor from my Ancient Times. His contention was that a precise definition of a field is an indicator of maturity of the field, not a precondition to begin. All that is needed is a loose common definition that serves to help form a self-identified community of interest. That is what you will find in this series – ideas culled from people who draw from concepts that are generally agreed to carry a “complexity” label. Those people can be found in many fields – physics, evolutionary biology, and economics, to name but a few.
Occasional: This series is “occasional” because its frequency depends on my time constraints and on the availability of interesting cases. I’d like to think that case authors will get something useful from their efforts through the knowledge that will come from our collaboration. We are always on the lookout for interesting cases. If you think you have one, please get in touch.
The Case:
Pathways to Home: Providing Wraparound Case Management and Clinical Services for Homeless Individuals in Aurora,
Case authors:
Leonardo Flores, Research Associate, Aurora Research Institute, LeonardoFlores@aumhc.org
Jessica Ipsen, PATH program manager, JessicaIpsen@aumhc.org
Antonio Olmos, Executive Director of the Aurora Research Institute, AntonioOlmos@aumhc.org
Case description
There is a significant need to provide homeless prevention, rehousing, and behavioral health interventions to individuals experiencing homelessness. The interrelationships of homelessness, mental illness and substance use disorders are complex and well-documented. Among individuals experiencing homelessness, 45 percent have a mental illness and at least 60 percent have a substance use disorder. Mental illnesses can make it difficult to earn a stable income and maintain housing. In fact, mental illness precedes homelessness in 2/3 of individual cases. Conversely, homelessness frequently precedes substance use disorder, with substance use being a form of self-medication for the stress of being homeless. The 2020 Metro Denver Homeless Initiative Point in Time survey indicated 245 individuals in Arapahoe County and 476 in Adams County experience homelessness, with 241 (33%) reporting a mental health issue and 228 (32%) reporting a substance use issue, most likely with many individuals reporting both conditions. Homeless individuals and families face numerous obstacles that undermine their ability to engage in services and resources necessary to better their mental health, and to engage in means to obtaining housing. This is exacerbated for individuals with mental health or substance use disorders who can experience health instability, cognitive and functional impairment due to symptom severity that increased the difficult to overcome homeless through obtainment of stable employment and affordable housing. The Aurora Mental Health Center receives funding from both the City of Aurora and the State of Colorado to address these problems. A model of the program as designed is shown in Figure 1.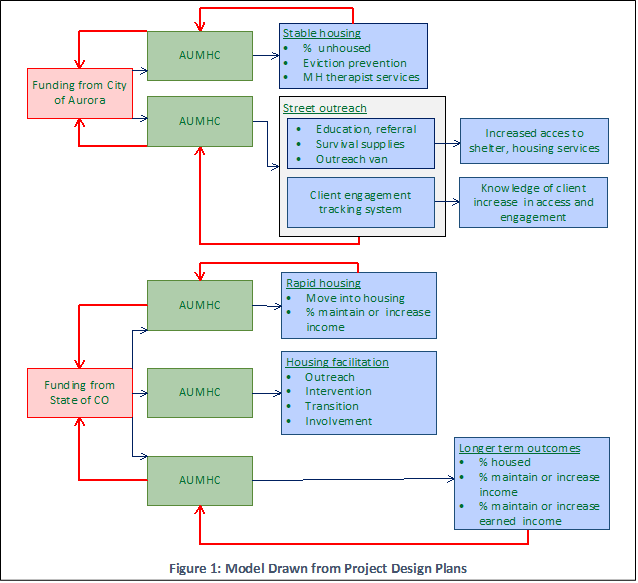
Thinking About the Case in Terms of Complexity
Applying a complexity lens to the PATH evaluation led to an ecosystem view with an emphasis on boundary crossings (Figure 2). This kind of movement is often thought of in terms of the behavior of complex systems. Also, conceptualizing PATH in terms of change over boundaries leads to two other constructs from complexity that are relevant – attractors and phase transitions. In Figure 2:
- the homeless population can be divided into those who are reachable by Pathways to Home and those who are not.
- Within the “reachable” category people can be housed but have a need for rehabilitation and habilitation services or they can be homeless.
- Both “reachable and homeless” and “reachable and housed but in need of rehabilitation and habilitation services” can receive mental health and supportive services, or not.
- Movement across these boundaries can be in both directions and can be specified in terms of volumes and rates.
- Solid lines represent movement that is within PATH’s scope of work. Success can be thought of as PATH activity that maximizes travel in the blue direction and minimizes travel in the red direction.
- Dashed arrows are movements that are of interest to PATH, and which may influence their success, but which are outside of their scope of work.
The foundation of data analysis would be a plot of all traffic on the same scale over the same period of time. It is the interest in flow that led to Figure 2 taking the form it did. The same information could have been represented in network form, which would have allowed some worthwhile measures of network characteristics, e.g., various centrality parameters. Figure 2 was chosen as a visual representation that stimulated a particular line of reasoning about PATH.
Traffic Rates
Data could be analyzed in both quantitative and qualitative terms. One analysis might apply calculus to determine and compare rates of change for each parameter. Qualitative analysis might observe and interpret directions. The specific analysis tools do not matter. What matters is the ability to observe and interpret changes that provide insight, and which would have been missed if only particular border movements were measured.
 Table 1 is an example of what might be gleaned by looking at traffic flow. Scenario 1 and Scenario 2 both show that for each unit of time, more and more people can be reached by service providers. The scenarios differ radically, however, because in the first, more and more people are leaving supportive services while in the second more and more people are entering supportive services. If I were the program designer or funder, I might make some very different decisions depending on which scenario obtained.Attractors
Attractors are complexity’s way of identifying “where systems like to be”, which is a loose anthropomorphic term that conveys an accessible definition. More technically,
In the mathematical field of dynamical systems, an attractor is a set of numerical values towards which a system tends to evolve, for a wide variety of starting conditions of the system. System values that get close enough to the attractor values remain close even if slightly perturbed (source).
Social attractors define a specific subset of states that a social system may take, which corresponds to its normal behavior towards which it will naturally gravitate (source).
Consider all the change rates that can take place in Figure 2. Any one of them, or all, can be measured with no reference whatsoever to an idea from complexity. Means, averages, and distribution shapes can be specified for each variable. What complexity adds is the idea that all those changes may move about within a “space” that is characterized by shape and depth. Specific values for each parameter may fluctuate, but overall, the topology of the space endures. Knowledge of that topology, and changes in it as a program operates, can provide insight that would not be known unless rates of change in the ecosystem were determined and the data were analyzed with respect to whether an attractor was or was not present.
 An example is presented in Figure 3. The periphery of each shape represents a plot for each month over a three-year period – thirty-six data points with connecting lines added for improved data visualization.
What does it mean to say that the data that made those shapes shows an “attractor”? It means that we may not know exactly what the “homeless x service pairing” will be for any given month, but that with three years’ worth of data we have a pretty good idea of the range. We know that over time the nature of homelessness and the nature of PATH operations are such that whatever happens, the measurement pairings will fall somewhere on those shapes.
Now imagine the two different scenarios in Figure 3. They tell radically different stories about needs and services. In Scenario 1, a narrow range of service recipients persists over a wide range of need. In Scenario 2, a wide range of service recipients persists over a narrow range of need. What is it that pulls the numbers to those values? Why is it that if we were to construct a world and drop a homeless phenomenon and a PATH-like program into it, those shapes will describe the data? We have no idea, but knowing the shape provides useful knowledge for planning and much fodder for speculation and further research.
Phase transitions
Phase transitions describe qualitative differences that occur very rapidly as a result of small change in a quantitative variable (source). In the physical sciences, “very rapidly” can be defined precisely, as for instance when there is a transition from a liquid to a gas state of matter under known combinations of temperature and pressure.
In our world “very rapidly” has a fuzzier definition, but the idea still holds. A recent example is Russia’s invasion of Ukraine. In a matter of two weeks an almost unimaginable change took place in Europe. The difference was qualitative, the sudden appearance of a different condition of human affairs. On a scale of “acceptance of Russia as a country we can work with politically, culturally and economically”, there was a new normal.
Example drawn from Figure 2
We have no data to determine whether phase transition behavior is taking place in PATH, but it is not hard to imagine such a phenomenon. Consider the “reachable at risk” population represented by the left side of the circle in Figure 2. Embedded in that population is a subgroup that is receiving mental health and supportive services.
We ask the question: How willing are members of the homeless population to accept mental health and supportive services? We want to know because it touches on how various outreach efforts are conducted. Knowing what we do about social influence, we hypothesize that the larger the number of people who are receiving services, the more willing will be the entire population to receive services. It is a social networking phenomenon that can be described by a graph that plots “number of people receiving service” against “homeless population’s opinion about mental health services”. It’s the same dynamic as an innovation adoption or a disease transmission model.
Phase transitions are very common in these circumstances. It would not be unreasonable to hypothesize that over a narrow range of “number of people receiving mental health services”, the culture in the entire homeless population shifts from “mental health service is something to avoid”, to a general acceptance that mental health services are a good idea. Note how our language has shifted from the quantitative (numbers of people with opinions) to qualitative (culture). This is the essence of a phase transition. It is not just an inflection point on a plot. It is that the culture has shifted on either side of the inflection point.
Case Summary, Mindset, and Skills
The PATH case dealt with services to the homeless who need both housing and mental health services. A traditional evaluation (Figure 1) was augmented with three constructs drawn from Complexity Science – change from an ecological perspective, attractors, and phase transitions. Each of these concepts cover program theory and data analysis for which someone might think: “I would have thought of that anyway. Why do
I need complexity to do it?” We offer two reasons.
Knowledge
Consider each of the aspects of complexity that we drew from for this case.
Movement within an ecosystem: Analysis of people’s movement from one category to another is a common activity in many evaluations. It does not require complexity to be interested in how many people moved from homeless to housed, or into and out of mental health care. But casting the question in terms of movement in an ecosystem provides an insight about what PATH might be doing, and how, rates. and the nature of success, that would not otherwise be evident.
Attractors: Evaluation of participation in outreach services would be part of any PATH-like program. But looking at the data in terms of attractor shapes provides knowledge that cannot be duplicated by our usual approaches to measuring change over time. Consider Figure 3. Data conforming to Scenario 1 would lead to very different beliefs than would be the case if Scenario 2 was evident.
Phase transition: Tracking outcomes over time is ubiquitous in evaluation, as is the detection of inflection points in those measurements. But interpretation of the data in terms of qualitative change, a new normal, on either side of those inflection points, is not something we usually do. Our contention is not that there will always be a phase transition. Our contention is that complexity teaches us that there might be such a transition, and that detecting it could be instructive
Approach to Inquiry
Complexity Science is more than a set of individual constructs. As ill-defined as the field is, it can still be said to consist of a loose aggregation of elements, e.g., models, data requirements, methodologies, data interpretation preferences, criteria for acceptable answers, research questions, characteristics of convincing arguments, favorite research designs, and the intellectual capital recruited for research teams. These elements are networked, with many affecting many of the others. The result is an emergent reality that engages inquiry in a unique way. Evaluation is also like that, and so exhibits its own unique engagement with inquiry. It is not our intention to transition evaluators from one approach to inquiry to another. But we do believe in the value of multi-disciplinary approaches to model building, methodology, and data interpretation. This series will be successful if it encourages evaluators to incorporate some complexity mindset into the models, methodologies, and data interpretation that constitute evaluation work.

Reblogged this on Systems Community of Inquiry.