PDF version Biotic_Hierarchy_as_a_Framework_for_Policy_Evaluation
In a previous blog post and in one of my You Tube videos I tried to make the case that different disciplines orient problem definition and solution in different ways, and that evolutionary biology and ecology lead researchers in different directions than do the social sciences. I followed this line of reasoning with the argument that evaluators’ traditional grounding in social science normally has been productive and that for the most part, we should continue to do what we have always done. Then, I tried to make the point that there are circumstances where thinking in terms of evolutionary biology and ecology can be a powerful addition to how we normally do our work. In this blog post I will show how policy evaluation is one of those circumstances when evolutionary / ecological thinking can be valuable.
Current Approach to Evaluating a Policy
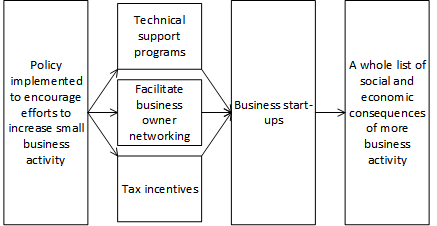
From logic models and depictions of program theory that I have seen, my impression is that policy evaluation is treated as program evaluation. By that I mean that specific consequences are expected from the policy change, and an outcome chain from policy to consequences is constructed. Figure 1 uses Small and medium sized enterprises (SME) as an example of what I mean.
Model of an Evolutionary Biological / Ecological Extension to Current Approach
Such a switch in viewpoint leads to two complementary perspectives on evaluating policy change (Figure 2). The first perspective is as before, as a program-like phenomenon that has expected outcomes (red arrows). The second is as a change in an ecosystem that takes place as a result of some combination of the specific project-like activities and system-wide changes (blue arrow).
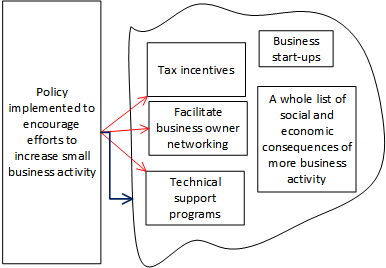
Figure 2 is the kind of model that any systems-sensitive evaluation might produce. What I hope to show is that evolutionary/ecological thinking leads to insights that other systems views would not likely elicit.
Analysis of Policy Based on an Evaluation Evolutionary Biological / Ecological Models
My starting point is the concept of a “biotic hierarchy”. Biotic hierarchies come in many forms, but the one I like to use is:
- organisms, nested within
- species, comprising a
- population, nested within a
- community comprised of all populations, nested within
- an ecosystem comprised of species, populations, and communities, and supporting constructs (e.g. geography, climate, food sources, etc.).
Define ecosystem boundaries
The first challenge is to define the ecosystem, i.e. to begin at the opposite end of the biotic hierarchy than would be the case in traditional evaluation, where the focus would be on a specific program. How to define an ecosystem? As in the field of ecology in general, there is no precise answer this question. It is possible, however, to identify rough boundaries.
To take the example in Figure 2, one might ask: What processes and structures might one reasonably expect to be affected by a change in the amount and type of SME activity? Of course the phrase “reasonably expect” is open to much interpretation and debate, and whatever choice is made can be challenged with the argument that everything is connected to everything else. But despite the ambiguity and criticism, a meaningful way to proceed is available. That framework rests on three guidelines for action. 1) Not everything is connected with equal strength, or at equal distance, to everything else. So one could start with a guideline along the following lines: Within five years, is there likely to be a change that is both observable and consequential? 2) False precision can be avoided by using broad categories such as “in”, “out”, and “maybe”. 3) In any case, initial estimates do not matter very much. All that is needed is a scoping exercise that is good enough to allow an evaluation to begin, i.e. resources allocated, methodologies chosen, data sets to be determined, and so on. Data analysis will provide guidance on how the ecosystem boundaries should be adjusted.
Evaluation questions at levels of the biotic hierarchy
Once the ecosystem is determined, it becomes possible to ask about change at different levels of the biotic hierarchy, as adaptations are made within the changed ecosystem. What might happen with SMEs, and how might those changes affect other activity in the ecosystem? Table 1 shows some possibilities.
| Table 1: Examples of Evaluation Questions Suggested by Biotic Hierarchy Levels | ||
| Evolutionary / ecological construct | Example of application to policy example in Figure 2 |
|
| 1 | Number of organisms | Numbers of existing types of businesses may increase of decrease. For instance at the time when the SME policy was implemented, there may be florists and machine tool makers in the population. Do their numbers increase or decrease over time after the new policy is implemented? What levels do they reach, and how stable are those levels? |
| 2 | Species decline and extinction | Florists and machine tool makers can be thought of as different species of SMEs. It’s one thing for their numbers to increase or decrease. Those numbers may fluctuate – maybe even by a lot. It is something else when those numbers decrease to zero, i.e. for the species goes extinct. For instance, it is not hard to imagine that new business conditions may make it possible for some businesses to diversify their product and service offerings, to the detriment of specialty enterprises. Does this happen? How much of it happens? |
| 3 | New species | New types of businesses may appear as a result of the SME policy. For instance, tax incentives may make it possible for highly capital-intensive business to be profitable, where they would not have been able to operate previously. What kinds of businesses appear? |
| 4 | Species diversity within a community | As some types of business go extinct and some new types appear, one might ask whether the number of different types of businesses increases or decreases within the ecosystem. |
| 5 | Selection pressure | Are selection pressures operating that affect business activity? For instance, as technical support becomes more available, is there a draw for businesses models that can exploit advanced technical knowledge? |
| 6 | Ecosystem change | Does the new business activity affect the ecosystem itself? For instance, does change in SME activity affect the levels of intellectual capital, investment capital, and disposable income that is available within the ecosystem? |
Measures that manifest themselves when using evolutionary / ecological thinking
Distributed across the questions identified in Table 1 are a small number of constructs that describe important aspects of what happens when a new policy is implemented.
- Community
- Rate of change
- Timing of change
Community
Prioritizing assessment of the makeup of a community is a natural consequence of thinking in evolutionary / ecological terms. (“Community” refers to the collection of all species living in an ecosystem.) Table 2 and Table 3 provide a sense of how thinking this way can
enrich our understanding of the consequences of a new policy. The tables portray a ridiculously simple situation, where only two broad classes of businesses are represented. Overly simplistic as it may be, I hope it conveys the value of evaluating policy in evolutionary and ecological terms. What would such data tell us about the consequences of the new SME policy?
| Table 2: % SME Types Before and After Policy Implementation | |||
| % of Community | |||
| Pre-policy Implementation | Post-policy Implementation | ||
| Type of Business |
Scenario 1 |
Scenario 2 |
|
| Light industry |
40% |
60% |
40% |
| Consumer goods and services |
60% |
40% |
60% |
| Table 3: # SME Types Before and After Policy Implementation | |||
| Population Count | |||
| Pre-policy Implementation | Post-policy Implementation | ||
| Type of Business |
Scenario 1 |
Scenario 2 | |
| Light industry |
100 |
300 |
120 |
| Consumer goods and services |
200 |
200 |
180 |
| Total population |
300 |
500 |
300 |
In scenario one we see that the policy resulted in two changes. First, (Table 2) the percentage of light industrial to consumer has reversed from 40% light industry, 60% consumer, to 60% industrial, 40% consumer. Second, the total population count (Table 3) has increased from 300 to 500. In scenario two the new policy has resulted in no change in either percentages or population count. (Of course these data say nothing about profitability, number of people employed, actions taken to adapt to the new policy, and so on.)
Rates of change
In evolutionary biology and ecology the question of how quickly (or slowly) change happens is a critical matter. For instance, consider population levels, extinction, and the appearance of new species. It is one thing for an evaluator to determine the number of specific kinds of businesses, whether some kind of businesses disappear, and whether new kinds of businesses appear.
| Table 4: Two Scenarios for Rates of Change | ||||
| Rate of Change | ||||
| Type of Business | Scenario 1 | Scenario 2 | ||
| Retail | High | Low | ||
| Small manufacturing | Low | High | ||
| Total number of establishments | 500 | 500 | ||
These are important things to know in terms of understanding the consequences of the new SME policy. But the evolutionary and ecological perspectives would also ask how about the rate at which these changes occur. Rates matter. To illustrate, consider Table 4. Imagine that the in both scenario one and scenario two, the numbers were the same for the numbers of new kinds of businesses that appeared and the number of old kinds of businesses that disappeared. I’d argue that despite the equality of population numbers, scenario 1 and scenario 2 in 4 show a very different impact for the new SME policy.
Timing of Change
Now introduce a third construct to those of numbers and rates – timing. Imagine that population numbers and rates of change are exactly the same, but there was a difference in the time at which change began to appear after the SME policy was implemented. An example is presented in Table 5. Even if numbers and rates of change were exactly the same in scenario 1 and scenario 2, those scenarios depict very different interpretations of the consequences of the new SME policy.
| Table 5: Timing of Change Post-SME Policy | |||||
| Years Post Implementation of SME Policy | |||||
| Scenario 1 | 1 | 2 | 3 | ||
| When does the number of retailers begin to increase? | X | ||||
| When do machine tool builders appear on the scene? | X | ||||
| When do specialty stores begin to disappear? | X | ||||
| Scenario 2 | |||||
| When does the number of retailers begin to increase? | X | ||||
| When do machine tool builders appear on the scene? | X | ||||
| When do specialty stores begin to disappear? | X | ||||
A Final Pitch for Thinking About Policy Evaluation in Evolutionary / Ecological
There is not much in anything I said above to which someone could reply: “I don’t need this evolutionary ecological stuff; I would have done that anyway.” That is a valid point. But I think that something else is true as well. The analyses I discussed should not be considered in isolation. Rather, the constitute a suite of analyses that dovetail with each other and inform each other. I do not believe that evaluators using only social science frameworks would produce the kind of understanding that an evolutionary ecological approach would provide.
